Purpose
The 'Select data options' page allows you to select time periods and change the layout of your table.
Navigation
For trade data, the Select data options page is displayed when you click the Go button on the Select variables page.

For non trade data, the Select data options page is displayed when you click the Options button at the bottom of the Select variables page.

Page example
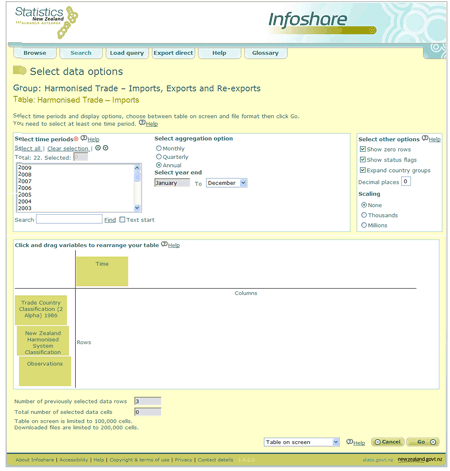
Figure 5.1 - Select data options page
Descriptions
Select data option functions and their descriptions are listed below.
Select time periods - Allows you to select time period(s) to include in your table.
Select all - Selects and highlights all values in the variable list.
Clear selection - Un-selects all values in the variable list.
Search - Enter a word or the start of a word and click 'Find'.
Text start - Tick the box to find all words starting with the letters or word entered in the search box.
Select aggregation option - This function allows you to set the time period aggregation. The options are:
 Monthly
 Quarterly
 Annual
This option is available for trade data only.
Select year end - This drop down list allows you to change from calendar years by selecting a different month for the year end.
This option is available for trade data only.
Select other options - Show zero rows displays rows that have all zero values
Show status flags - shows status code of the data. Valid values are:
 C: Confidential
 E: Early estimate
 P: Provisional
 R: Revised
 N: No applicable data can be displayed
Expand country groups - lists all member countries of a country group and their relevant data separately. This option is available for trade data only.
Decimal places - number of decimal places displayed up to a maximum of 6.
Scaling - Values can be scaled to 'Thousands' or 'Millions'. Select 'None' to not scale at all. The scaling option used will be displayed in the table footnotes. For example, Magnitude = Units (in 1s, 1000s or 1000000s)
This option is not available for non trade data.
Trade totals - Show country totals adds a total column to the end of the table to show totals across all countries selected.
Show HS code totals adds a total column to each country to show totals across all HS codes selected.
Click and drag variables to rearrange your table - The variables you have selected are displayed in this section as rows or columns. You can rearrange the layout of your table by clicking on and dragging the variable to a new position, in either a row or column indicated by the red bulls eye. Please note that the red bulls eye will only display in Internet Explorer browsers.
Number of previously selected data cells - Number of data cells selected in the Select variables page.
Total number of data cells - Total number of data cells selected for query. This is calculated by multiplying the number of selected data cells by the number of selected time periods.
 - Dropdown menu for output format options.
 - Output to format chosen in dropdown menu.
 - Return to the previous page and do not apply selections.
Steps
To specify time periods or layout options on the Select data options page:
- Select one or more time periods by either:
 Holding down either the SHIFT or CTRL key on your keyboard and highlighting the relevant time periods by scrolling up or down the time period list.
 Type the time period required in the 'Search' field and click Find.
- If you wish to select all time periods, click Select all.
If you wish to clear your selections, click Clear selection.
- Select a time period aggregation by selecting the relevant aggregation radio button.
- Select a month for the 'year end' by selecting one from the month dropdown menu.
- Select output formatting options by clicking on the relevant checkbox under the 'Select other options' list. Format options are:
 display zero rows
 show status flags
 expand country groups
 decimal places
- Select scaling option by clicking on the relevant radio button. The default value is no scaling.
- Select show country totals and HS code totals by clicking the relevant checkbox under the trade totals heading.
- The variables you have selected are displayed in this section as rows or columns. You can rearrange the display of your output by clicking on and dragging the variable to a new position, in either a row or column.
- Select how you wish to have your data displayed by selecting an output format option in the dropdown list. Options are:
 Table on screen
 Excel file (.xls)
 Comma delimited (.csv)
 Table query (.tqx)
- Click Go
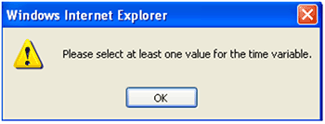
- If you have not selected any time periods for your table and click Go, the system displays the following message, indicating you have not selected a value for the time variable.
- If you have selected more than 50,000 cells for 'Table on screen' or 'Table query (.tqx)' download and click Go, the system displays the following message, indicating that you have selected too many cells.

If you have selected more than 100,000 cells for 'Excel file (.xls)', 'Comma delimited (.csv)' and click Go the system displays the following message, indicating that you have selected too many cells.

Click OK to acknowledge the message and return to the Data options page. To reduce the number of selected cells, you may need to de-select some time periods or use a larger time period aggregation. Alternatively you may return to the Select variables page by selecting the back arrow of your browser's menu bar and reduce the number of values selected.
- Click Go
- The 'View table' page displays the data for your table.
Purpose
The 'View table' page (see figure 5.2) displays on screen the data from the variables you have selected and allows you to further customise the data and format the table to your requirements before downloading or printing.
Navigation
The 'View table' page is displayed when the 'Table on screen' format option is chosen from the dropdown menu and you click the 'Go' button.

Page example
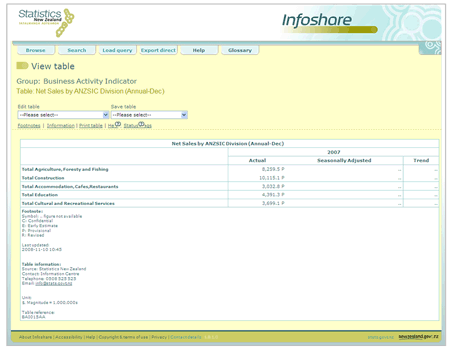
Figure 5.2 - View table page
Descriptions
View table functions and their descriptions are listed below.
Edit table - This dropdown menu provides the following formatting options:
 Remove zero rows - removes rows that contain only zeroes.
 Show status flags - displays the status flags within the table. See footnotes for definitions.
 Remove status flags - remove status flags from the table. Please note status flags are not display as default.
 Pivot clockwise - rotates the variables clockwise.
 Pivot anticlockwise - rotates the variables anticlockwise.
 Change layout - the variables you have selected are displayed in this section as rows or columns. You can rearrange the display of your output by clicking on and dragging the variable to a new position, in either a row or column.
 Change text/code presentation - allows you to choose to display codes or text or both.
 Change decimal places - allows you to change the number of decimal places shown in the table, up to a maximum of 6 decimal places.
Each of the above options can be confirmed by clicking the 'Go' button or rejected by clicking the 'Cancel' button.
Save table - This dropdown menu provides the following download options:
 Excel file (.xls) - allows you to open or save the table in Excel format.
 Comma delimited (.csv) - allows you to open or save the table as a comma separated variable file.
 Table query (.tqx) - allows you to save the table as an Infoshare table query file.
Footnotes - This link takes you to the footnotes which includes status flag definitions and when the table was last updated.
Information - This link takes you to the information related to the table including source, contact information, unit of measure and the unique table reference.
Print table - Allows you to print the current table.
Status flags - Displays the 'Help' page for status flag information.
Steps
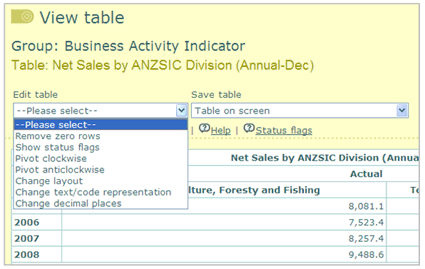
Figure 5.2.1 - Edit table dropdown list
- To remove zero rows and reduce the number of cells displayed select 'Remove zero rows' from the 'Edit table' dropdown list.
To move variables clockwise select 'Pivot clockwise' from the 'Edit table' dropdown list.
To move variables anticlockwise select 'Pivot anticlockwise' from the 'Edit table' dropdown list.
To show status flags select 'Show status flags' from the 'Edit table' dropdown list. They can be removed by selecting 'Remove status flags'.
- To change the layout manually select Change layout from the 'Edit table' dropdown list. This will open the 'Change layout' dialog box as shown in figure 5.2.2.
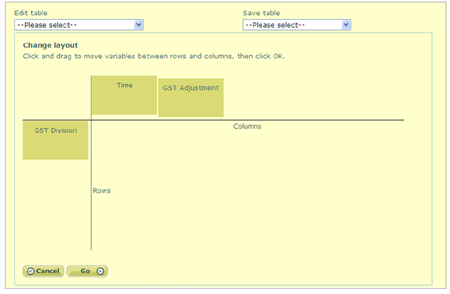
Figure 5.2.2 - Change layout dialog box
Rearrange the layout of your table by clicking on and dragging a variable to a new position, in either a row or column.
- To change the text/code representation select Change text/code representation from the 'Edit table' dropdown list. This will open the dialog box as shown in figure 5.2.3.
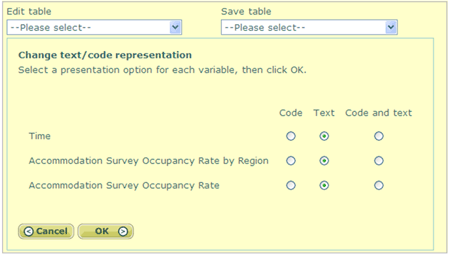
Figure 5.2.3 - Change text/code representation dialog box
Click OK to apply the selections or Cancel to reject the selections. The selections will remain until a new query is run or changed.
- To change the number of decimal places displayed select Change decimal places from the 'Edit table' dropdown list. This will open the dialog box as shown in figure 5.2.4.

Figure 5.2.4 - Change number of decimal places dialog box
Enter the number of decimal places up to a maximum of 6 and click OK to confirm or Cancel to reject the change.
- Output options are available from the 'Save table' dropdown list.
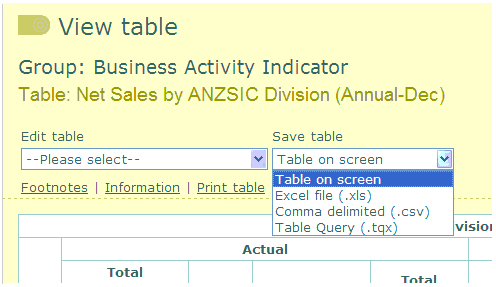
Figure 5.2.6 - Save table dropdown menu
To save or open as an Excel file, select Excel file (.xls) option from the dropdown menu. This will open the window as shown in figure 5.2.7.
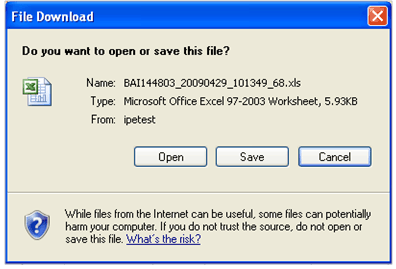
Figure 5.2.7 - Window open or save as an Excel file
Click Open to open the file in your Microsoft Excel application. The file can then be saved and further analysed offline. If you do not have Excel you will be prompted for an application to use. You can download the Excel Viewer from Microsoft for free.
Click Save to select the folder on your computer you want to save the file into. You can save the file as the default name or enter in your own file name. Clicking on OK will save the file on your computer. See figure 5.2.8 below.
Click Cancel to close the window without performing any actions.
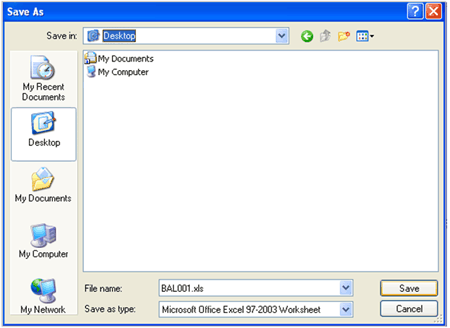
Figure 5.2.8 - Save window for Excel download
The other options available that follow the same steps as described are:
 Excel file from screen (.xls)
 Comma delimited (.csv)
 Table query (.tqx)
- If your table contains a large number of cells and you select 'Excel file (.xls)', 'Comma delimited (.csv)' or 'Table query (.tqx)' from the 'Save table' dropdown list, the system displays the following message, indicating that you have selected a large amount of cells.

Click OK to acknowledge the message and continue with the download or Cancel to display the 'View table' page.
If you select 'Excel file (.xls)' a second message will be displayed indicating that the table contains more than 256 columns which pre-2007 versions of Excel cannot display.

Click OK to acknowledge the message and continue with the download or Cancel to display the 'View table' page.
- To print the table on screen click the Print table link as shown in figure 5.2.9.
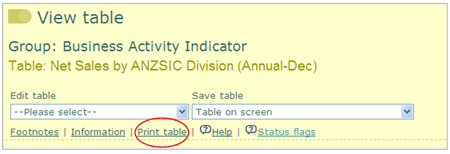
Figure 5.2.9 - Print table option
A new window will open with a printable version of the table along with the print dialog box. This has been specially formatted to print in the best possible way to avoid heavy use of ink and ensure that all data is within the print margins. See figure 5.2.10.
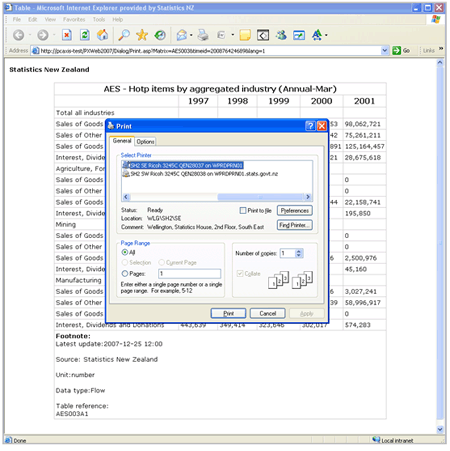
Figure 5.2.10 - Print table view and dialog box
Technical information
If you are using Microsoft Office Excel 2007 you will be prompted with the warning as shown in figure 5.2.11 when using the 'Excel file (.xls)' option. This is a security feature of Excel 2007 and is not a problem with Infoshare. By clicking Yes it will continue to open the Excel file without any issues. Read more on this issue here.

Figure 5.2.11 - Excel 2007 warning prompt window
Table information provides useful information, including the table reference. This should be quoted when contacting Statistics New Zealand in regards to a particular table. Contact information is also listed, along with unit of measure, as shown in figure 5.2.12.

Figure 5.2.12 - Table information
Footnote describe the definitions for the status flag displayed within the cells. and when the table was last updated (as shown in figure 5.2.13).
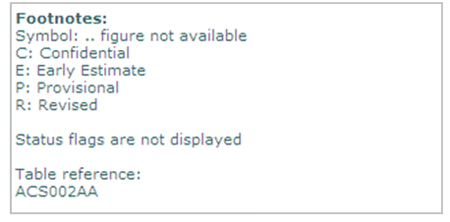
Figure 5.2.13 - Footnote
Tips
If you are using pre-2007 versions of excel and get the 256 columns prompt then click Cancel and change layout so time is in the columns and all other variables are displayed in rows. This only applies if you have less than 256 time periods.
Always use the Print table option, as printing using the Internet Explorer file print option will not remove the images and navigation.
If the table viewed on screen contains many rows the 'Footnotes' and 'Table information' will not be visible unless you scroll to the bottom of the browser window. A quick way to access this information is to click either the Footnotes or Information links.
Changing the decimal places does not imply increased accuracy. If the data is stored to 2 decimal places, increasing the number of decimal places to 6 will not give you more accurate data, only more zeroes at the end.